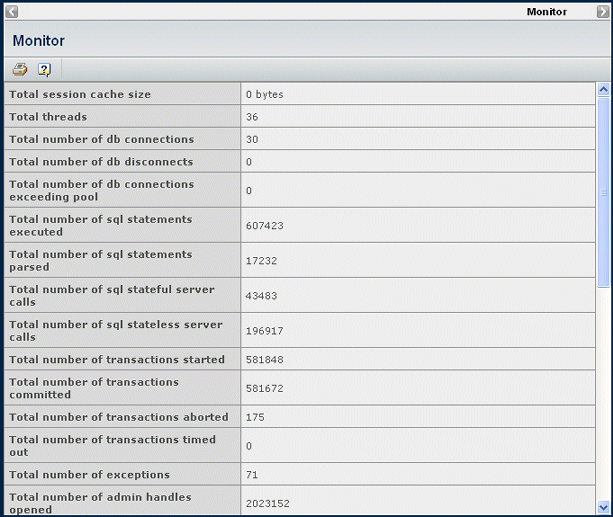
Session Monitor | ||
| ||
You must be logged in as a user assigned to the Administration Manager role.
You access the Session Monitor report by selecting from the global toolbar.

This table lists the session information that is affected by ENOVIA Live Collaboration or application server settings. All MX_ settings are environment variables.
| Session Information | Affected by this setting: |
|---|---|
Total threads |
MX_MAX_THREAD, executeThreadCount WebLogic setting |
Total number of db connections |
MX_CONNECTION_POOL_SIZE |
Total number of transactions timed out |
MX_TRANSACTION_TIMEOUT, MX_ABORT_DANGLING_TRANSACTION |
Number of free Tcl interpreters in pool |
MX_PROGRAM_POOL_SIZE |
Memory Reserved (blocks) |
MX_MEMORY_KEEP_LIMIT, MX_MEMORY_SYSTEM_LIMIT |