Memory Troubleshooting Procedures | ||||||
|
| |||||
Tool Selection
Depending on where the memory problem is, different tools are needed to diagnose it. An ENOVIA Live Collaboration Server configuration and a growth of the ENOVIA Live Collaboration Server process suggest a problem in the C++ core. Growth of the application server process or Java OutOfMemoryExceptions indicate a problem with the Java heap. There may be no clear initial indication of a memory problem in a RIP environment. In this case, run the application server JVM with -verbose:gc and graph the heap over time. If this indicates a Java side leak, use a profiler or similar tool to find the problem. See Java Memory Problem, below, for details
![]()
Java Memory Problem
The first step is to run the application server JVM with the option "-verbose:gc" and capture the output in a file. This will print verbose garbage collection records, which look similar to the following:
[GC 137851K->122823K(260160K), 0.0128460 secs]
[GC 139015K->123987K(260160K), 0.0126110 secs]
[GC 140179K->125151K(260160K), 0.0128070 secs]
[GC 141343K->126313K(260160K), 0.0131270 secs]
Then use a tool like gcviewer from http://www.tagtraum.com or GC Portal from SUN Microsystems to visualize the output. In the following example, a JSP was supposed to print a record of the last ten requests, but instead of saving data for the ten most recent requests, it saved all requests. The code looks as follows:
<%! static Vector vClients=new Vector(100);
    class clsRow {
        Date _dTime=null;
        String _sSession=null;
        String _sHost=null;
        public clsRow(String sSession, String sHost) {
            _dTime=new Date();
            _sSession=sSession;
            _sHost=sHost;
        }
        public String toString() {
            StringBuffer sb=new StringBuffer("<tr>");
            sb.append("<td>");
            sb.append(_dTime.toString());
            sb.append("</td><td>");
            sb.append(_sSession);
            sb.append("</td><td>");
            sb.append(_sHost);
            sb.append("</td>");
            sb.append("</tr>\n");
            return( sb.toString() );
        }
    };
%>
<%
    vClients.add(0, new clsRow(session.getId(),
            request.getRemoteHost())
    );
%>
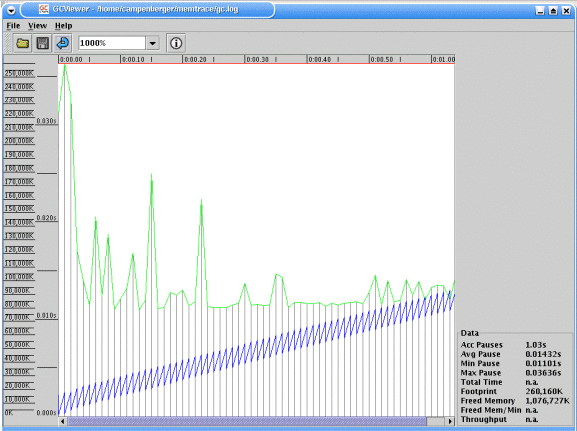
The JSP ran in a Tomcat 4 application server and was requested by five jmeter threads about 150000 times. The verbose garbage collection log was visualized with gcviewer.
Note the blue line in the graph, which shows the total heap used, the amount of
memory recovered with each garbage collection and a clear upslope. The
upslope indicates a Java memory leak.

Finding the leak is the much more difficult part. One method is to run the JVM with the built-in profiler, which is available in the JVM from SUN Microsystems. For the above example, the application server JVM was run with the option -Xrunhprof:heap=sites,depth=10,thread=y. This currently does not work with a WebLogic server because it monitors heap usage itself and interferes with this setting; only Tomcat has been successfully used with -Xrunhprof. Use of the option generates a very large file called java.hprof.txt, and also has a significant performance impact. The generated file can be reviewed manually or with a tool like Hpjmeter from http://www.hp.com.
It is preferable to perform such an investigation in a controlled environment. A repetitive test should be used and executed by a load-generating tool, like LoadRunner, grinder, or jmeter. Also after the test has completed, the test instance should be left idle until all active sessions have timed out.
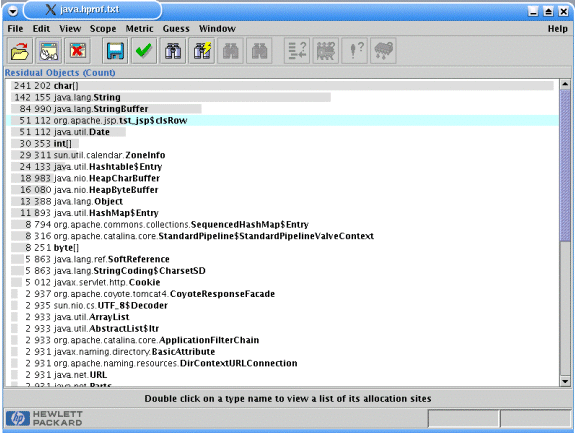
For our example we used Hpjmeter and displayed the Metric "Residual
Objects (Count)", which produced the list below. 
There are obviously many system objects, making it difficult to identify the culprit. However, upon closer inspection, tst_jsp$clsRow stands out. It is a class from the example with about 51000 existing instances, whereas only 10 instances should exist.