Event Objects | ||||||
|
| |||||
Monitoring Agent Events
The monitoring agent monitors itself by sending the following event object at each time interval:
| Source Name | enovia.monitoring_agent | |
| Thematic | Constant value: Availability | |
| Severity | Constant value: Information | |
| Extended Elements: | ||
| period | The amount of time (in seconds) between each request for monitoring information sent by the agent | |
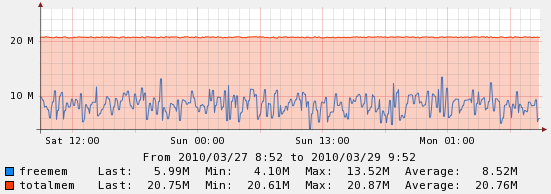
| totalmem | The total amount of memory available in bytes for the monitoring agent | |
| freemen | The approximate amount of memory available in bytes for future monitoring agent event objects | |
| Alert Criteria | A high priority alert message should be raised
by the monitoring solution if the enovia.monitoring_agent event is not
found for a period of time longer than the amount of time between each
request for monitoring information. The monitoring solution should restart
the agent. If the monitoring agent was stopped as part of a planned maintenance operation, this alert will not be sent. There is no alert criteria for the totalmem and freemem elements since the amount of available memory changes often. The graph below contains example totalmem and freemen values for certain times: |
|
If a fatal error is caught before the agent stops, the following event object is immediately sent regardless of the time interval:
| Source Name | enovia.monitoring_agent |
| Thematic | Constant value: Availability |
| Severity | Constant value: Fatal |
| Message | The error message, usually a Java stack trace |
| Alert Criteria | A high priority alert message should be raised by the monitoring solution if the enovia.monitoring_agent event is received with fatal severity. The monitoring solution should restart the agent. |
![]()
DS License Server Events
If the monitoring agent is configured to monitor a DS License Server instance, the following event object is sent at each time interval:
| Source Name | enovia.dslicsrv |
| Source PID | Process ID of the configured DS License Server instance |
| Thematic | Constant value: Availability |
| Severity | Constant value: Information |
| Alert Criteria | A high priority alert message should be raised
by the monitoring solution if the enovia.dslicsrv event is not found
for a period of time longer than the amount of time between each request
for monitoring information. The monitoring solution should restart the
DS License Server. If the DS License Server was stopped as part of a planned maintenance operation, this alert will not be sent. |
If a critical error occurs with the DS License Server, the following event object is sent:
| Source Name | enovia.dslicsrv |
| Thematic | Constant value: Availability |
| Severity | Constant value: Critical |
| Message | Message about the DS License Server not being available |
| Alert Criteria | A high priority alert message should be raised
by the monitoring solution if the enovia.dslicsrv event is received with
critical severity. The monitoring solution should restart the DS License
Server. If the DS License Server was stopped as part of a planned maintenance operation, this alert will not be sent. |
![]()
MCS Events
MCS Login Availability
At each time interval, the monitoring agent logs into the configured ENOVIA Live Collaboration Server instance. The following event object is sent if that login fails:
| Source Name | enovia.mcs.login |
| Thematic | Constant value: Availability |
| Severity | Constant value: Fatal |
| Message | The exception caught by the agent when login failed (invalid login, missing license for the login, etc.) |
| Alert Criteria | A high priority alert message should be raised
by the monitoring solution if the enovia.mcs.login event is received.
The monitoring solution should restart the ENOVIA Live Collaboration Server.
If this event object is received multiple times within a short period, a higher priority alert should be raised since manual intervention is probably needed. For example, the following issues would cause this event object to be generated multiple times and require manual intervention: The user name and password being used by the monitoring agent to log into the MCS is no longer valid. The user name does not have the correct license assigned. The MCS's protocol, host, port or root URI has changed. |
MCS Status
Event object sent for MCS status.
| Source Name | enovia.mcs.status | |
| Thematic | Constant value: Usage | |
| Severity | Constant value: Information | |
| Extended Elements: | ||
| server start date | Date the server was started | |
| server uptime | Amount of time the server has been running | |
| exception counter | Number of exceptions encountered. This count only includes exceptions returned by the kernel when a ENOVIA Studio Customization Toolkit call is performed. This count does not include other types of exceptions. | |
| Alert Criteria | A high priority alert message should be raised
by the monitoring solution if the 'exception counter' is received showing
one of the following: A sudden growth in the 'exception counter' compared to the 'ADK calls counter' (part of the enovia.mcs.adk event object). A sudden growth would be if the 'exception counter' exceeds the 'ADK call counter' by a magnitude of 20% over the sampling time used to compute the growth. If the monitoring agent was started after the MCS or RMI server, then it is possible that a sudden growth could be unnoticed. To prevent this, an alert should be raised if 'exception counter' > XX% of 'ADK call counter' where XX% equals the recommended 20%. If the 'exception counter' is received, the monitoring solution should restart the ENOVIA Live Collaboration Server to avoid a crash. If the 'exception counter' is received frequently, then a manual review of the log files should be done. |
|
MCS Memory
Event object sent for MCS memory statistics.
| Source Name | enovia.mcs.memory | |
| Thematic | Constant value: Performance | |
| Severity | Constant value: Information | |
| Extended Elements: | ||
| kernel memory highwater | Amount of highwater memory bytes. | |
| kernel allocated bytes | Amount of memory bytes allocated in the given number of allocated blocks. | |
| kernel allocated blocks | Amount of allocated blocks | |
| kernel reserved bytes | Amount of reserved memory bytes | |
| kernel reserved blocks | Amount of reserved blocks | |
| JVM total memory | Total amount of JVM memory available | |
| JVM max memory | Maximum amount of JVM memory available | |
| JVM memory in use | Current amount of JVM memory in use | |
| JVM available processors | Number of JVM processors available | |
| Alert Criteria | A high priority alert message should be raised
by the monitoring solution if one of the following occurs: The 'kernel allocated bytes' is greater than the 'system cache limit' (part of the enovia.mcs.setting event object). When this occurs, the Flash cache is used which decreases ENOVIA Live Collaboration Server performance. The recommended remedy for this alert is to use multiple servers with a load balancer. The load balancer should be configured to route new client sessions to servers where 'kernel allocated bytes' is lower than 'the system cache limit' until the alert is no longer being sent for the current server. The 'kernel allocated bytes' is very close to 'system memory limit.' The monitoring solution should restart the ENOVIA Live Collaboration Server. The JVM has very little memory available. The recommended remedy for this alert is to re-tune JVM parameters as described in Troubleshooting ENOVIA Live Collaboration. The application server's JVM parameters should be tuned in case of an RIP deployment and the RMI server's JVM parameters should be tuned in case of an RMI type deployment. |
|
MCS Studio Customization Toolkit Count
At each time interval, the following event object is sent with the MCS ENOVIA Studio Customization Toolkit count or the number of current, active ENOVIA Studio Customization Toolkit operations. This information can be used at times of less than optimal performance to determine what if any ENOVIA Studio Customization Toolkit calls could be causing the problem.
| Source Name | enovia.mcs.adk | |
| Thematic | Constant value: Usage | |
| Severity | Constant value: Information | |
| Extended Elements: | ||
| ADK calls counter | Number of method calls from the Java side of the ENOVIA Live Collaboration Server into the C++ Kernel. If you are using an RMI type deployment, these method calls will be remote calls. | |
| maximum program depth | The deepest recursion level detected. ENOVIA Studio Customization Toolkit calls can be recursive; one calling into another. |
|
| Alert Criteria | The 'ADK calls counter' is used in the alert
criteria for MCS Status. A high priority alert message should be raised by the monitoring solution if the 'maximum program depth' causes an MCS failure. The level of recursion for ENOVIA Studio Customization Toolkit calls in the MCS is tied to the maximum size of the program stack. The recommended remedy for this alert is to tune the maximum stack size using either the -Xss JVM option for Sun JVM or the -Xmso JVM option for IBM JVM on AIX or when using WebSphere. See JVM Options. |
|
MCS Database Count
Event object sent for the MCS database count.
| Source Name | enovia.mcs.db | |
| Thematic | Constant value: Usage | |
| Severity | Constant value: Information | |
| Extended Elements: | ||
| DB connection counter | Number of database connections | |
| DB disconnection counter | Number of database disconnections | |
| DB exceeding connections counter | Number of database connections exceeding the size of the database connection pool. The connection pool is determined by the MX_CONNECTION_POOL_SIZE setting for the ENOVIA Live Collaboration Server. | |
| SQL statement executed counter | Number of SQL statements executed | |
| SQL statement parsed counter | Number of SQL statements parsed | |
MCS Settings Count
Event object sent for the MCS settings count.
| Source Name | enovia.mcs.settings | |
| Thematic | Constant value: Usage | |
| Severity | Constant value: Information | |
| Extended Elements: | ||
| System memory limit | High water mark of allowable memory allocation for the native Live Collaboration kernel. This value is the same as MX_MEMORY_SYSTEM_LIMIT, see the "Memory variables" section of the ENOVIA Live Collaboration Server Administration Guide. | |
| System cache limit | Threshold on memory consumption for all threads, before using the database. This value is the same as MX_CACHE_SYSTEM_LIMIT, see the "Memory variables" section of the ENOVIA Live Collaboration Server Administration Guide. | |
| Alert Criteria | There are no recommended alert criteria for this event object. Although, it is recommended to use this event object to define alert criteria for other MCS events. | |